
STRAVA LOCAL
Final Screens from Local
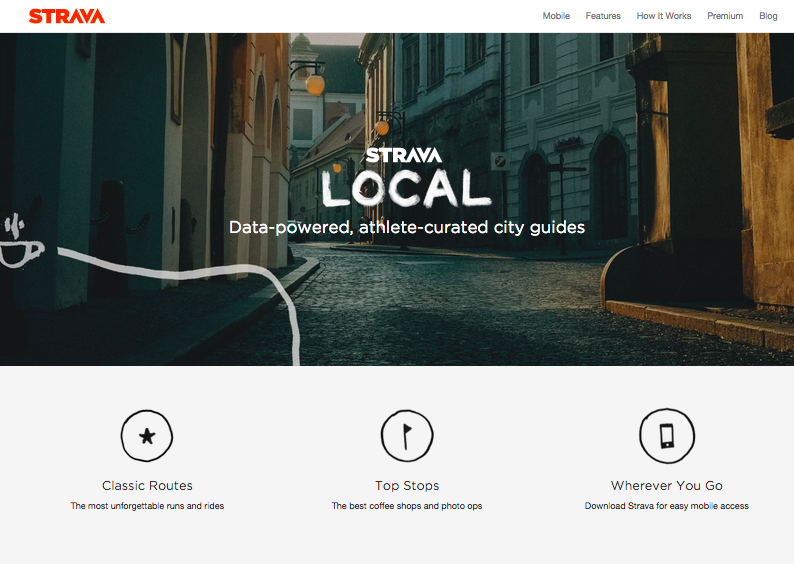


The Story
Curated routes for running and cycling in the world's most iconic cities. These are the best routes with the best stops and sights, driven by our athlete community and activity data. Local serves not only as an exploration tool for athletes to these iconic cities, but also to introduce a wider audience to the community.
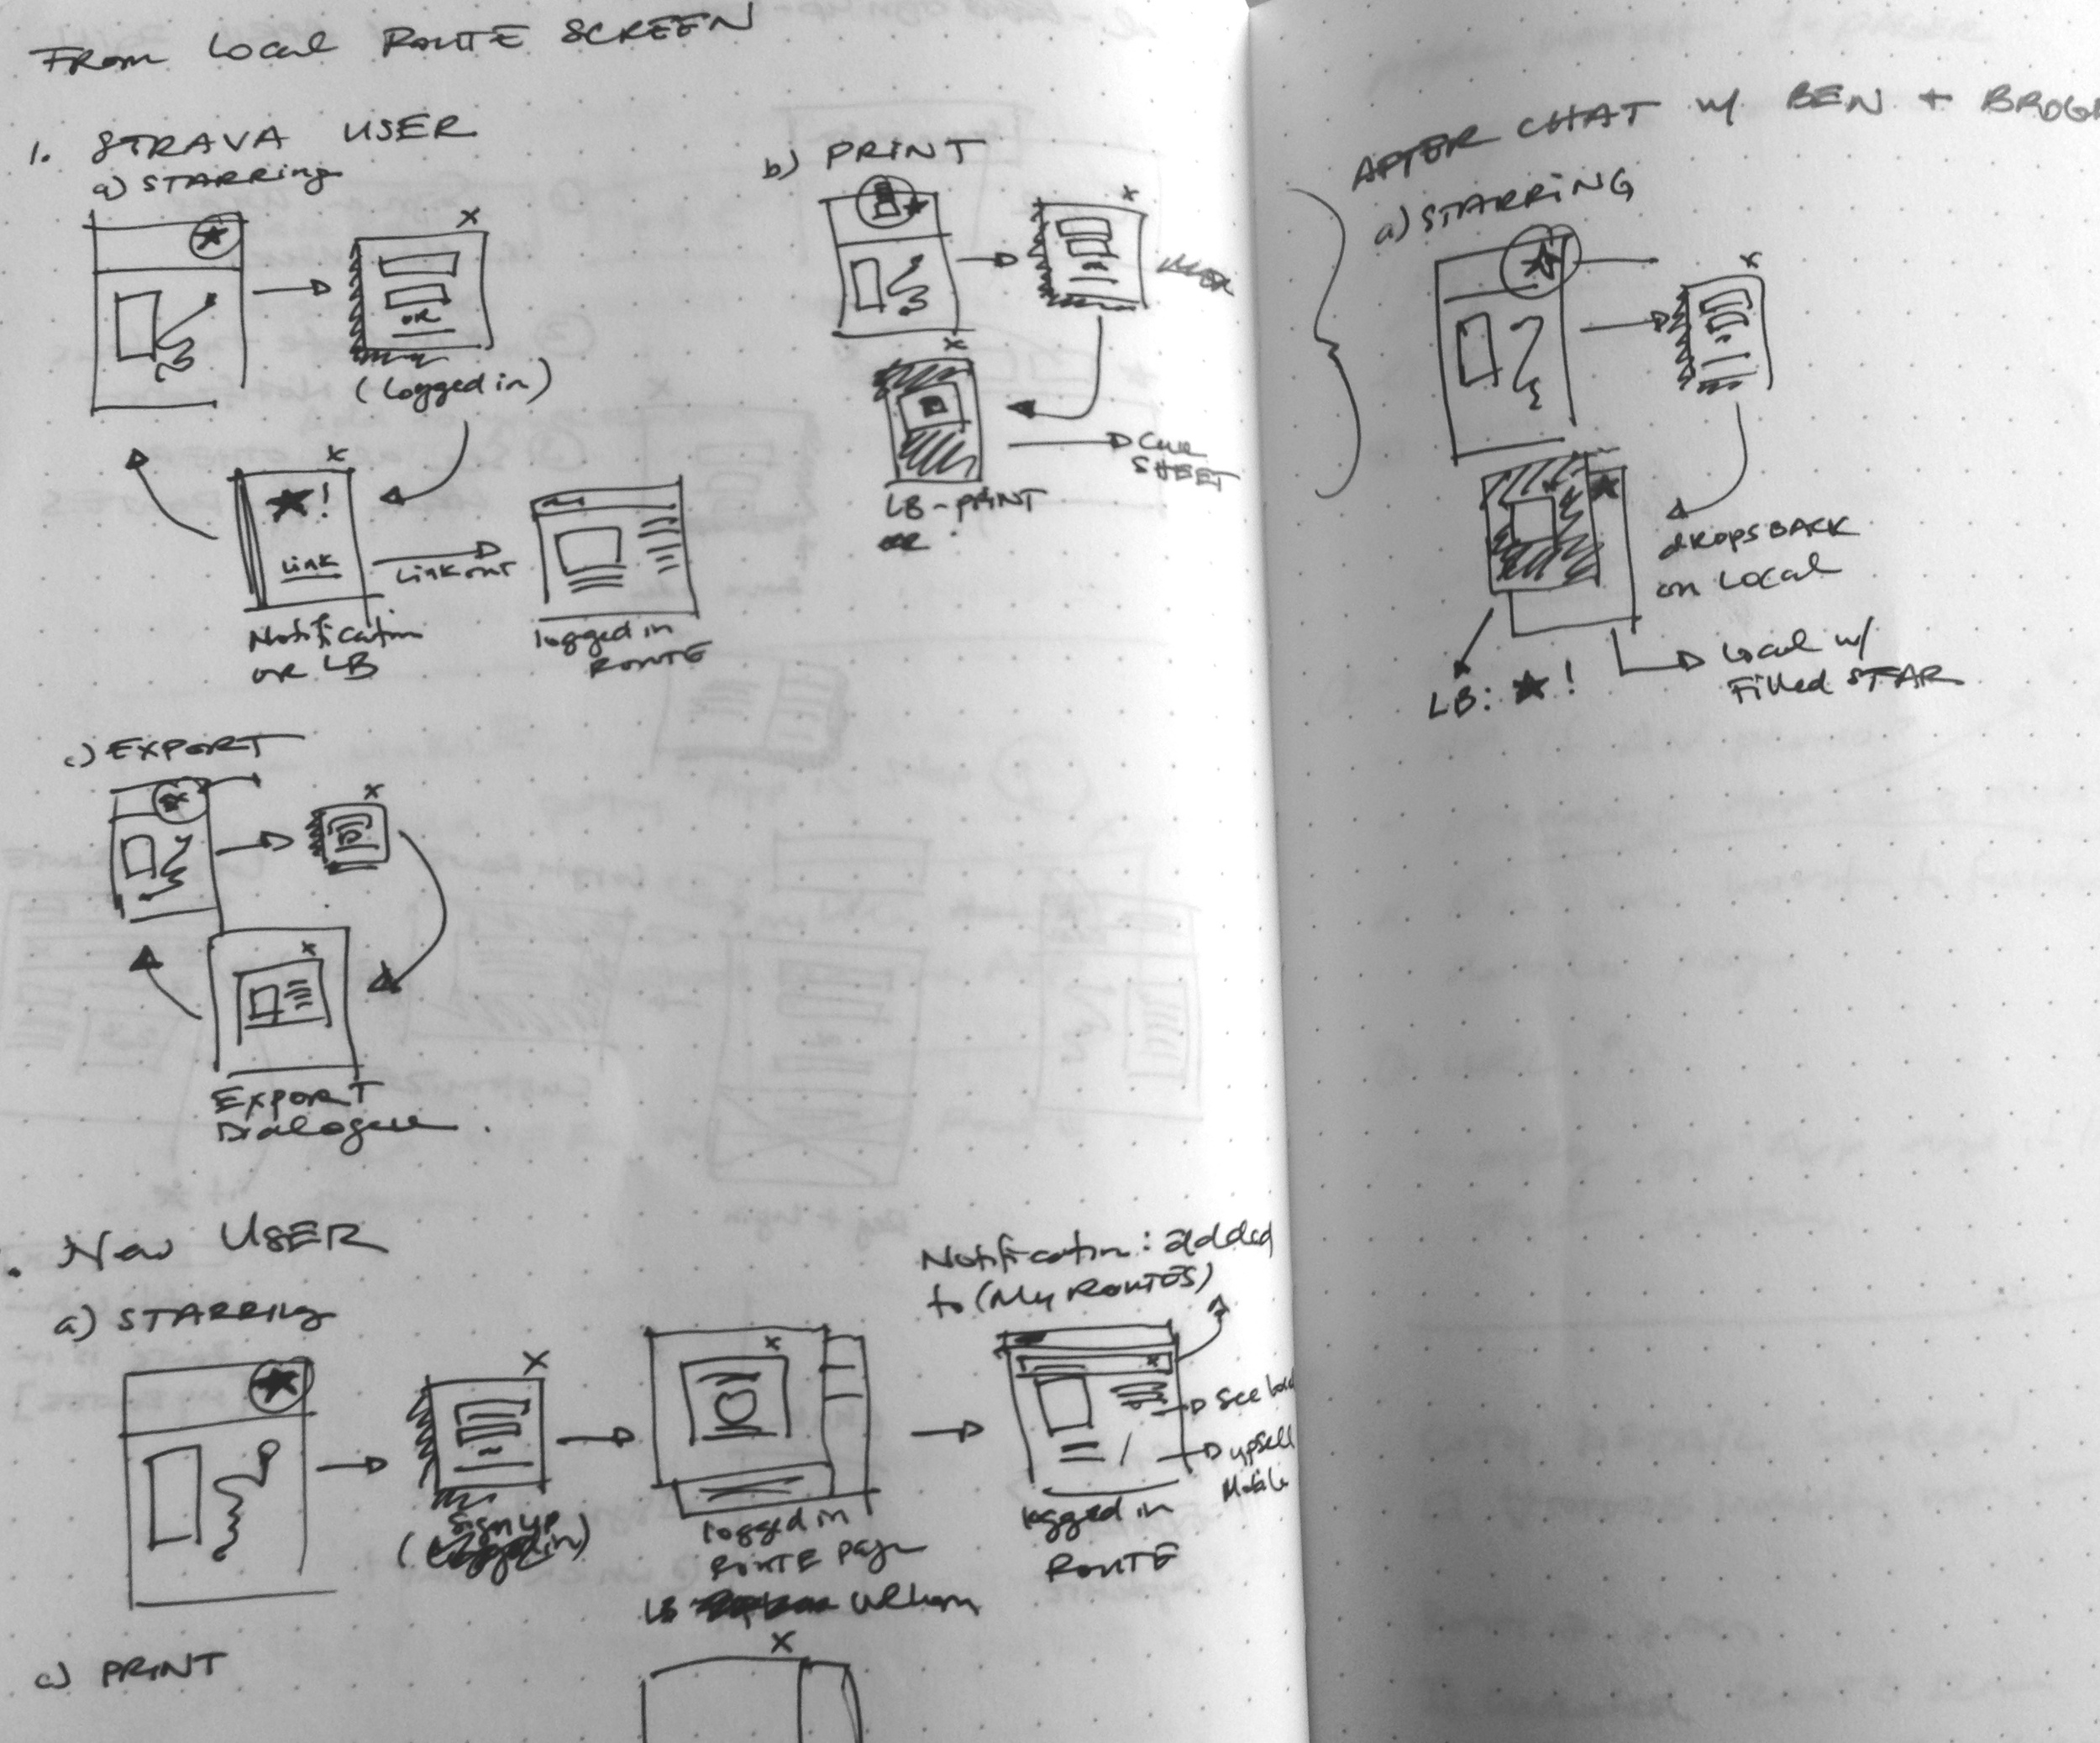
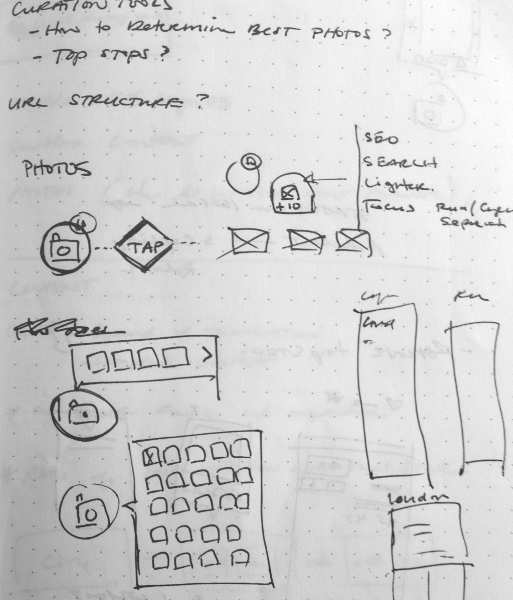
Sketches for landing screens and use cases for bringing in a user from Local to Strava active
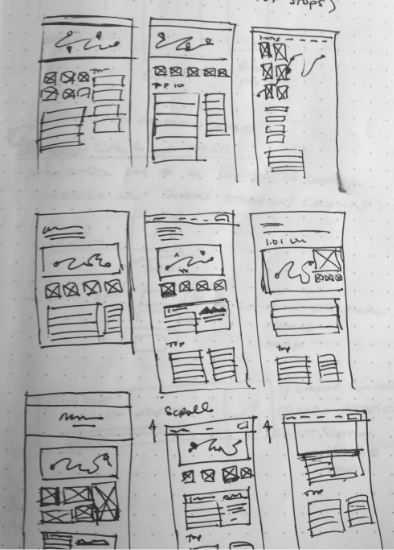
Wireframes and early mockups

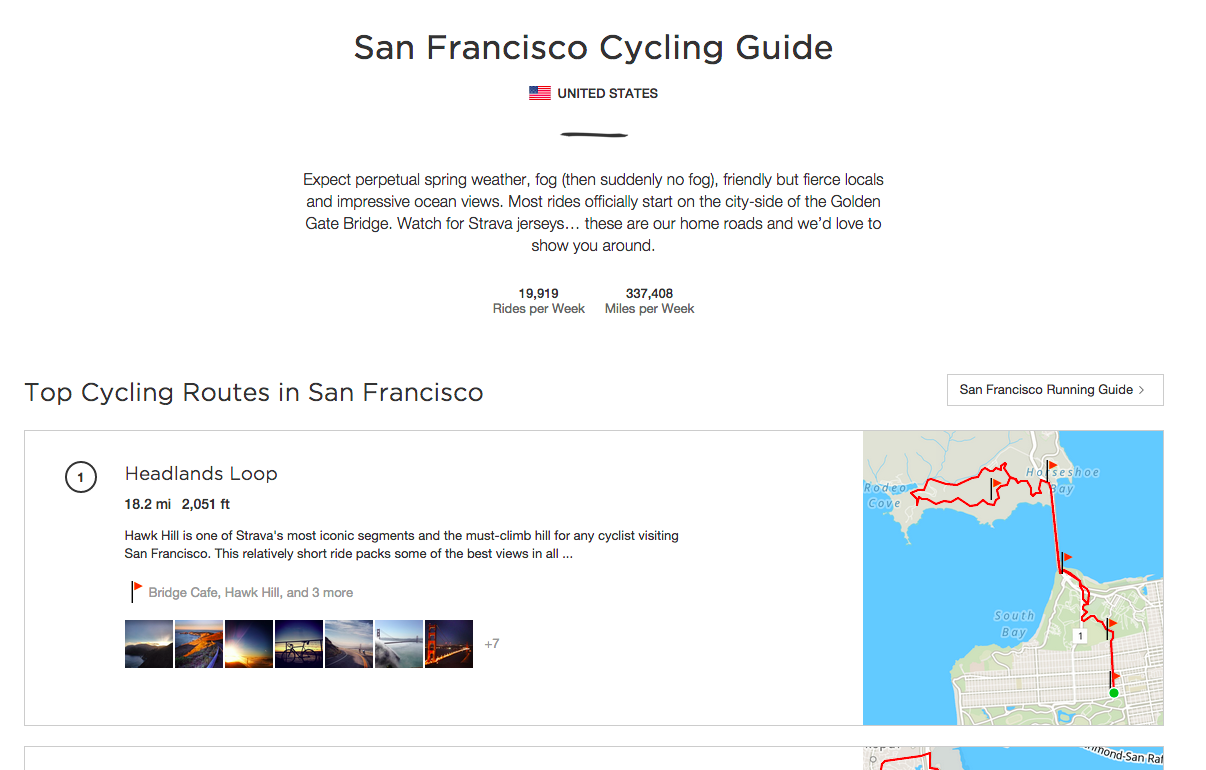
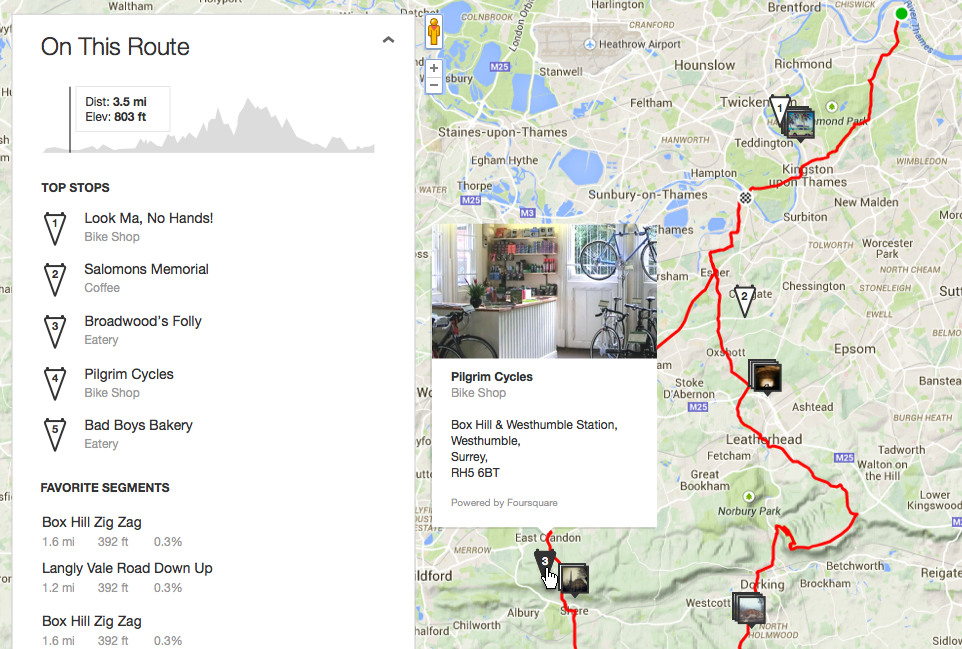
Designing for responsive web and internationalization were some key requirements. I created wireframes and early mockups that I presented to my team. We used this to determine user flow, layout, and phase 1 requirements. Then I designed the UI and interactions for the interactive route map including modals powered by activity data and Foursquare checkins and user-generated photos. The goal was to use the map and route to tell a story of where athletes stop and what to expect when exploring that area.
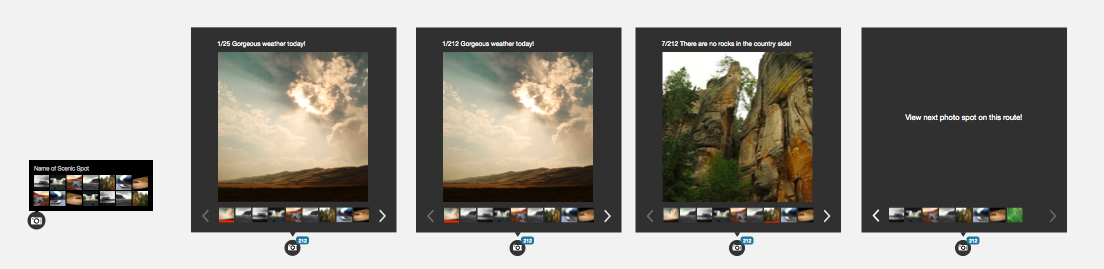
Sketches of photos displayed on route map and route map interactions
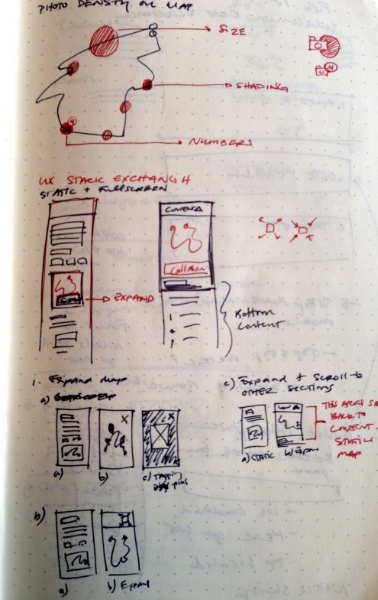
Close up of Top Stop Modal on Interactive Route Map and Photo Viewing Exploration
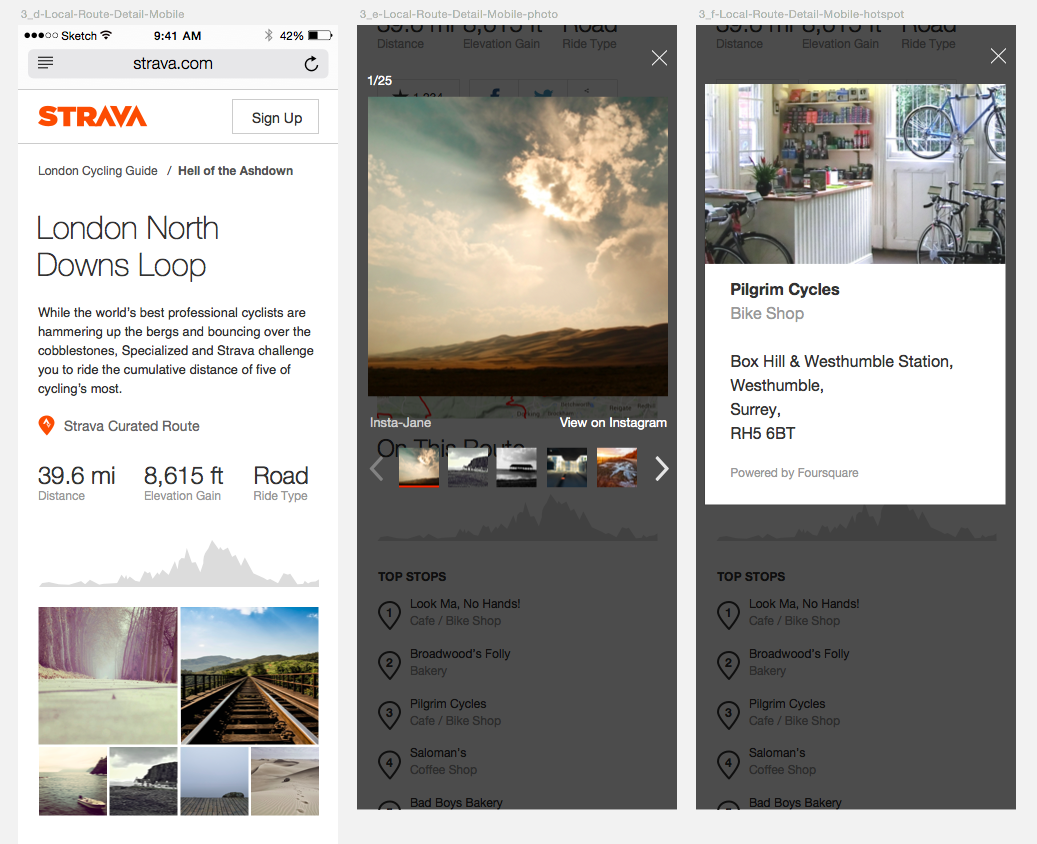
To finalized the project, our brand team started finalizing creative assets like illustrations and photos. I worked with them to finalize photo selects and implementation.
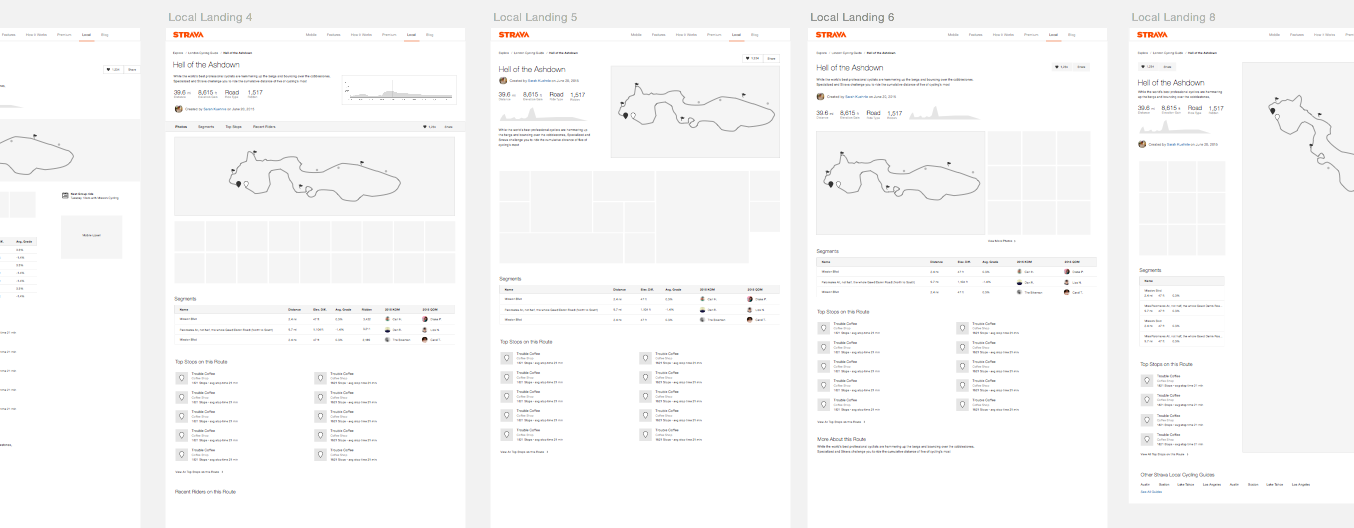
Final Mockup before Branding
Check it out in the wild at strava.com/local
Strava run training plans + Workout Analysis
Run training plans screens with cycling training plan calendar update
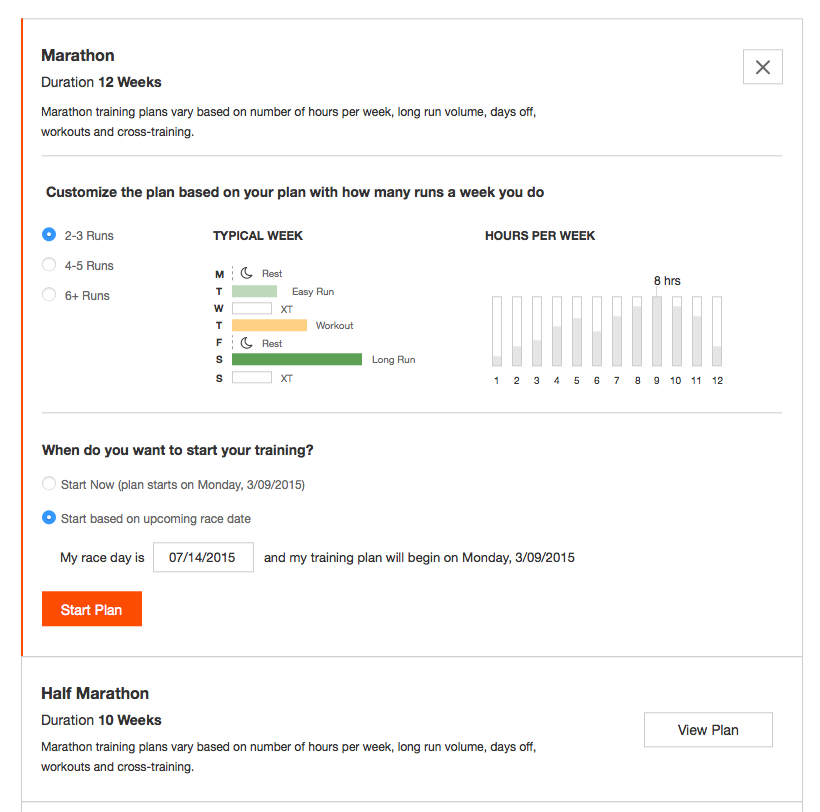
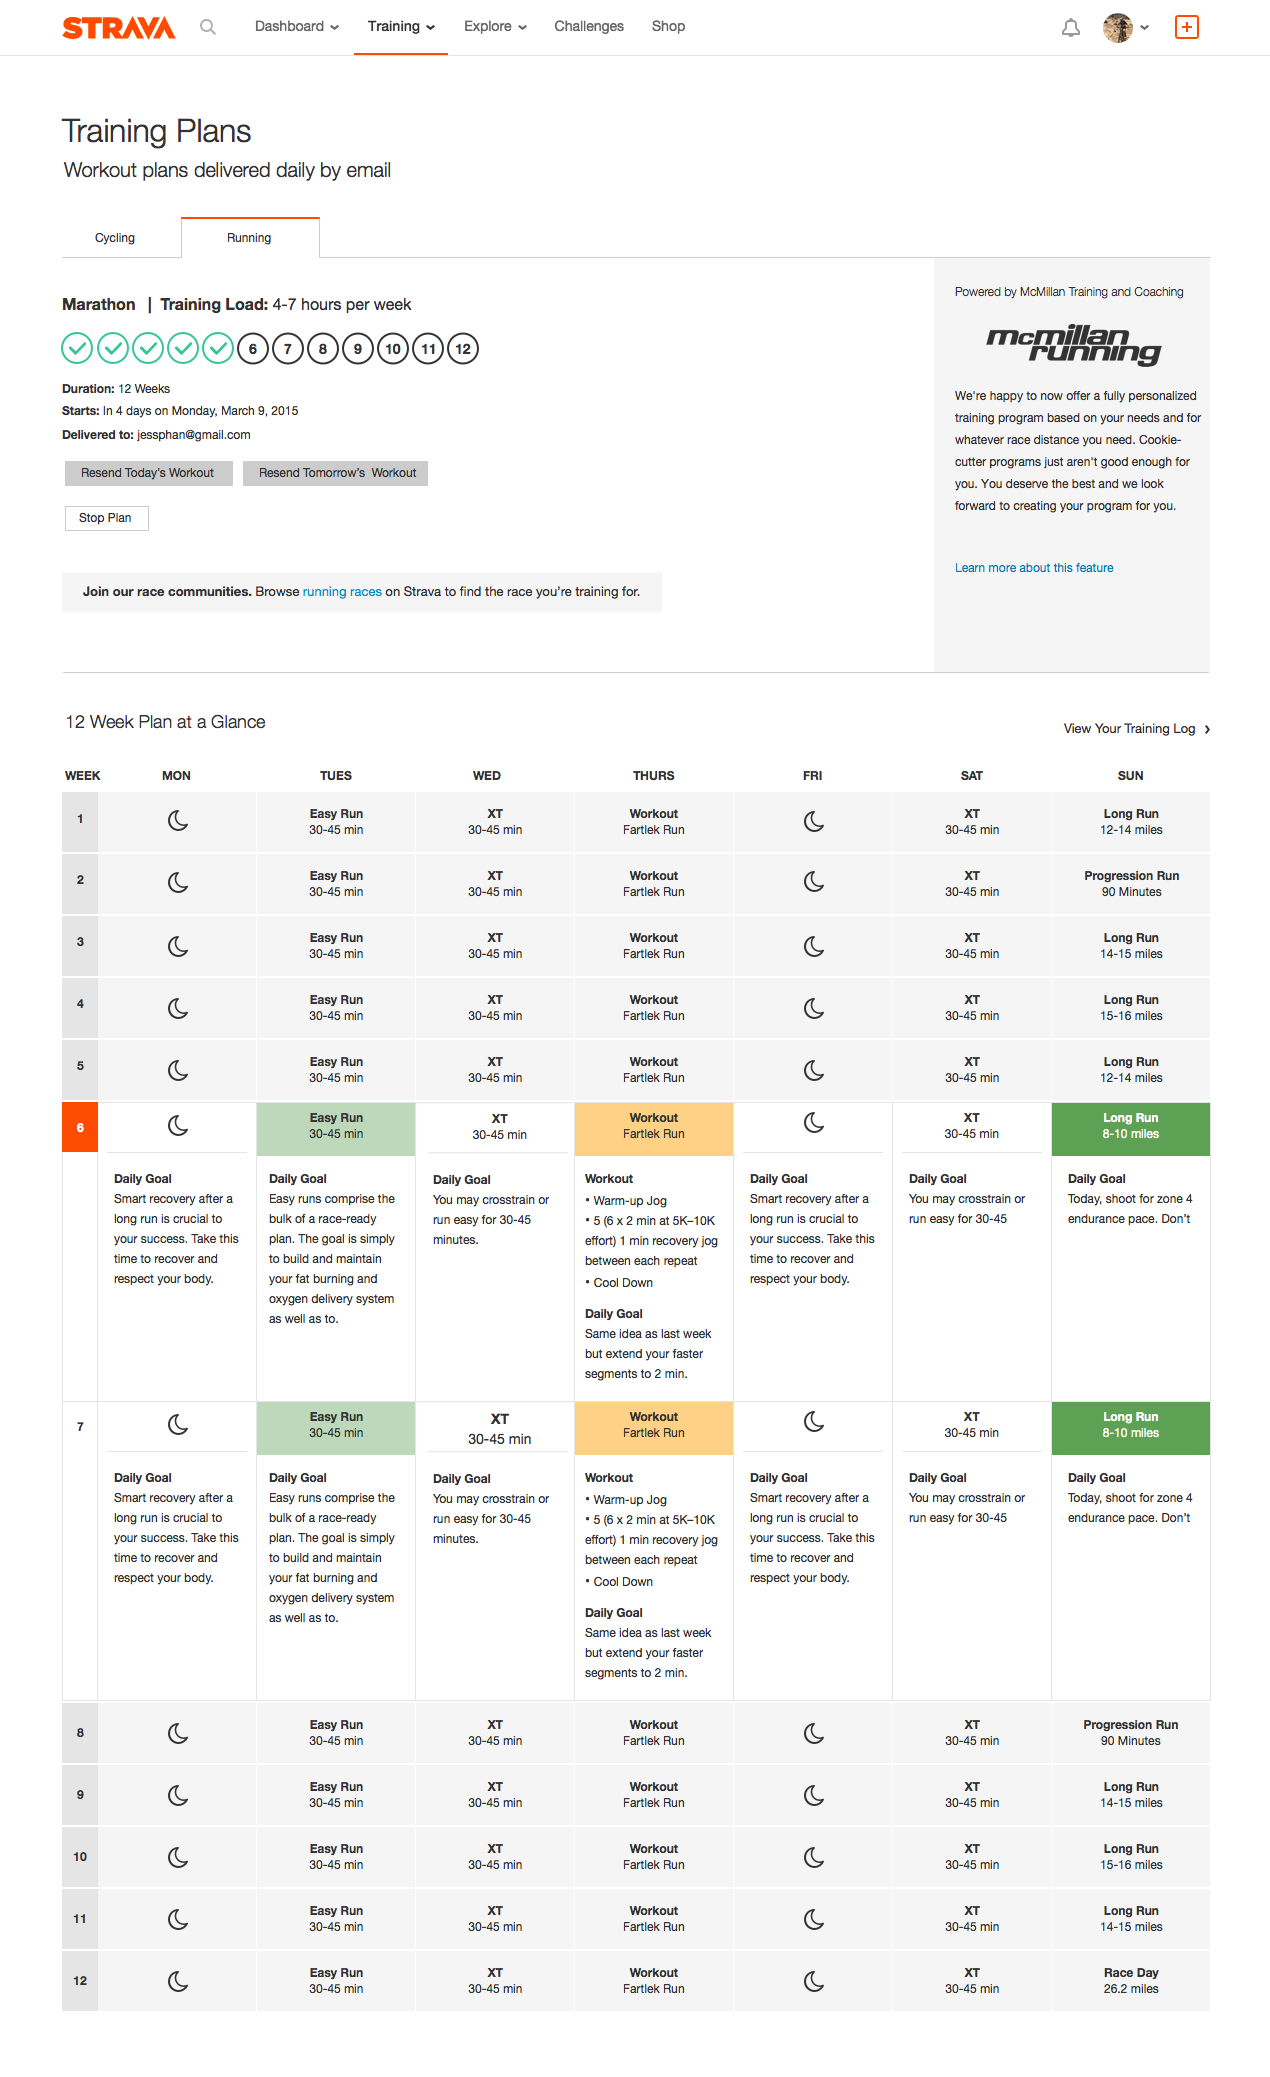
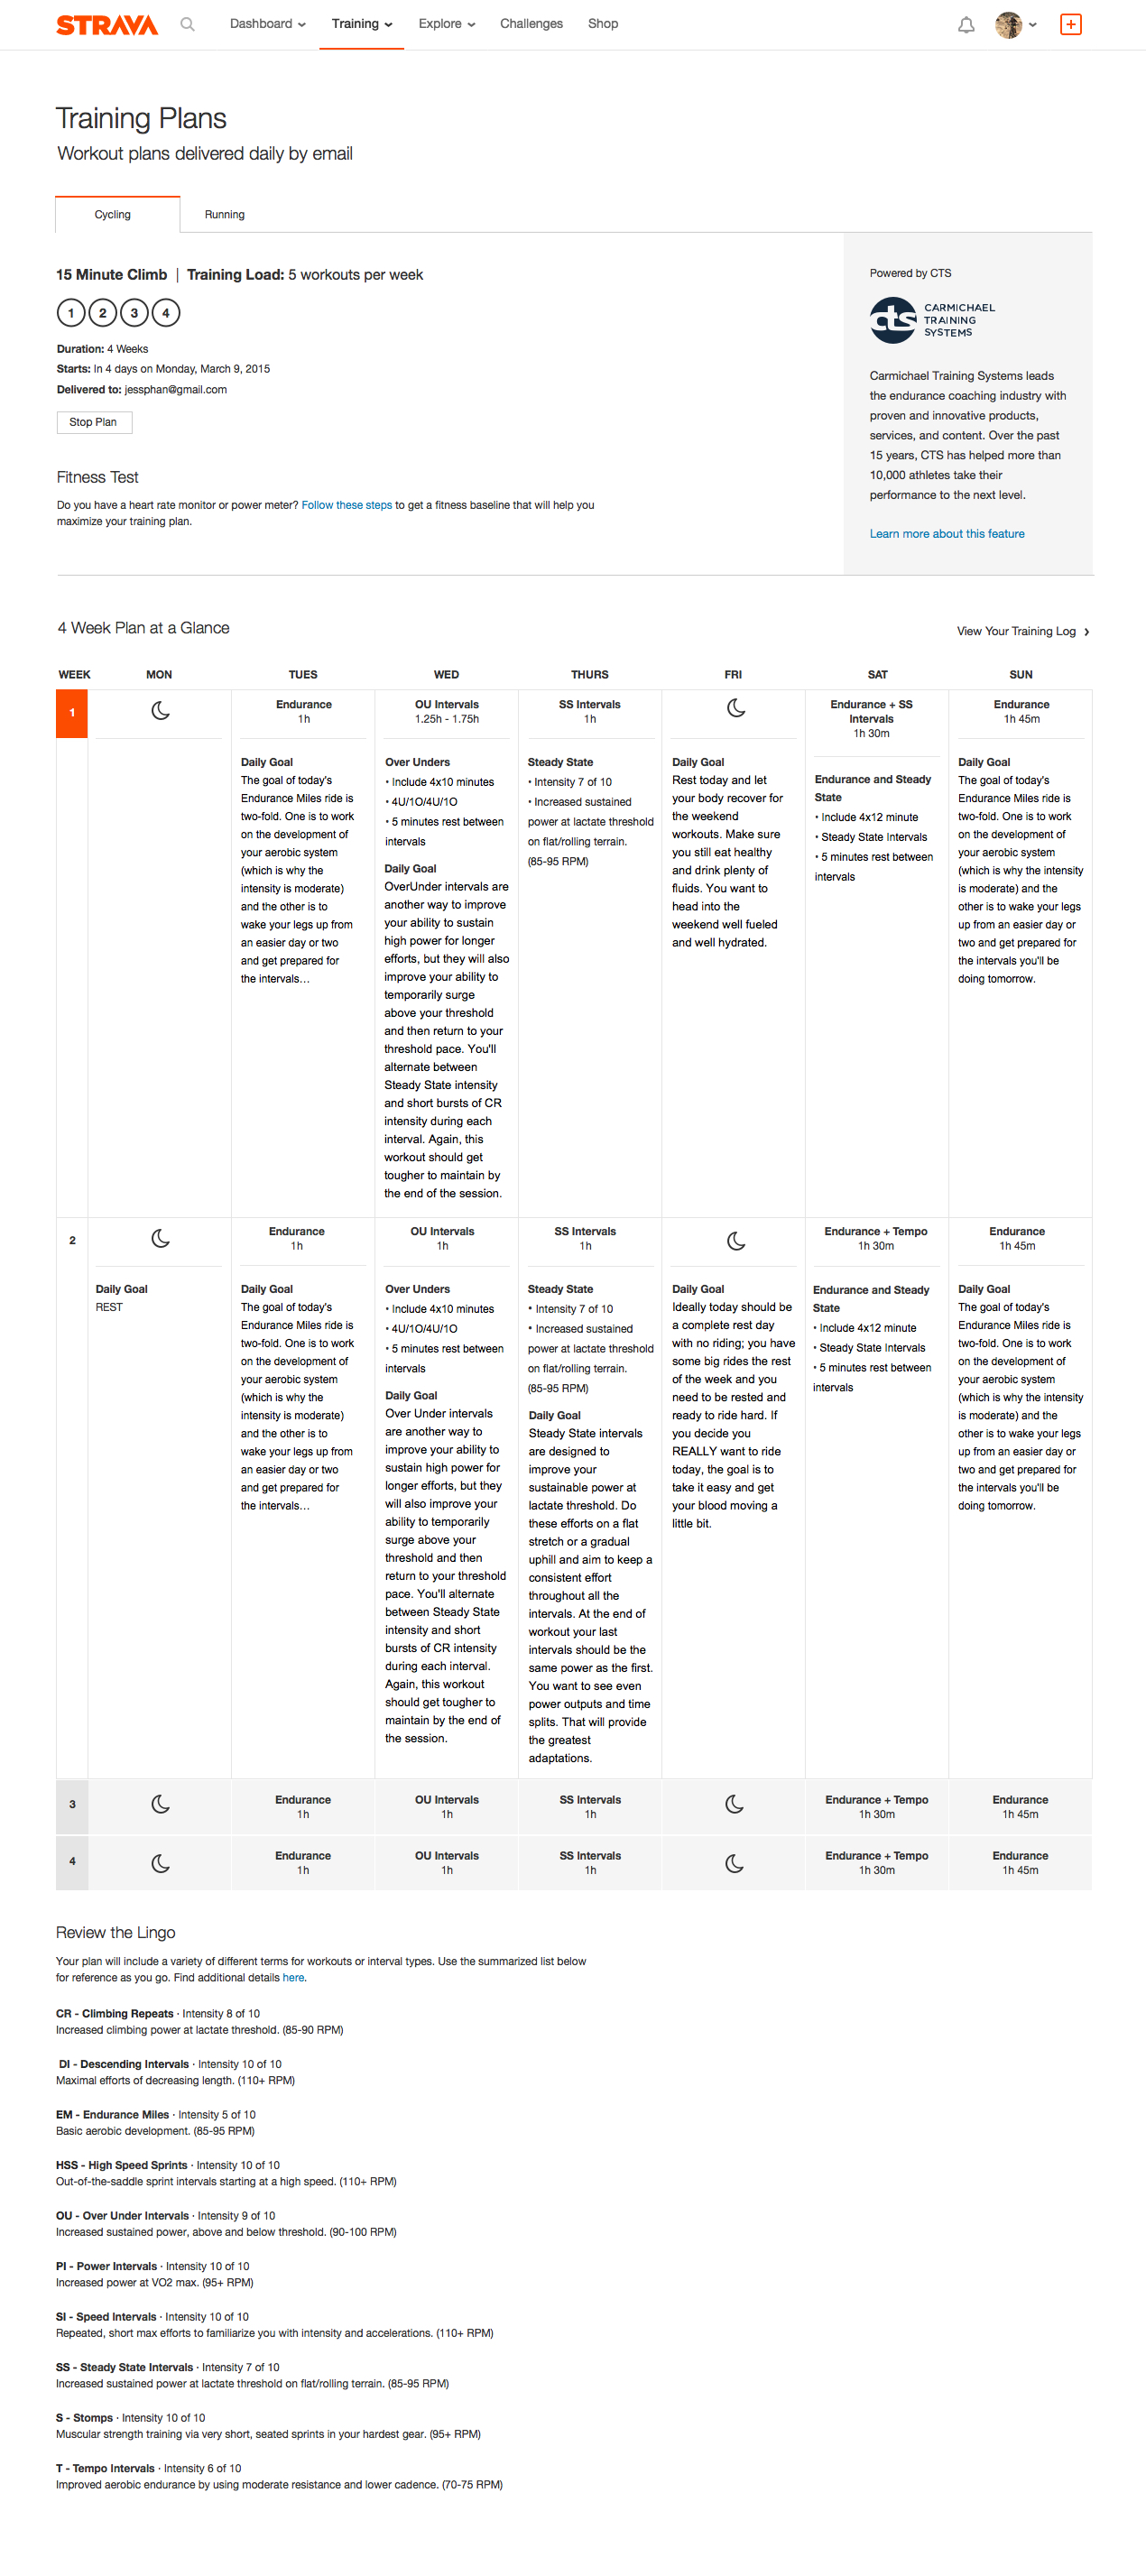
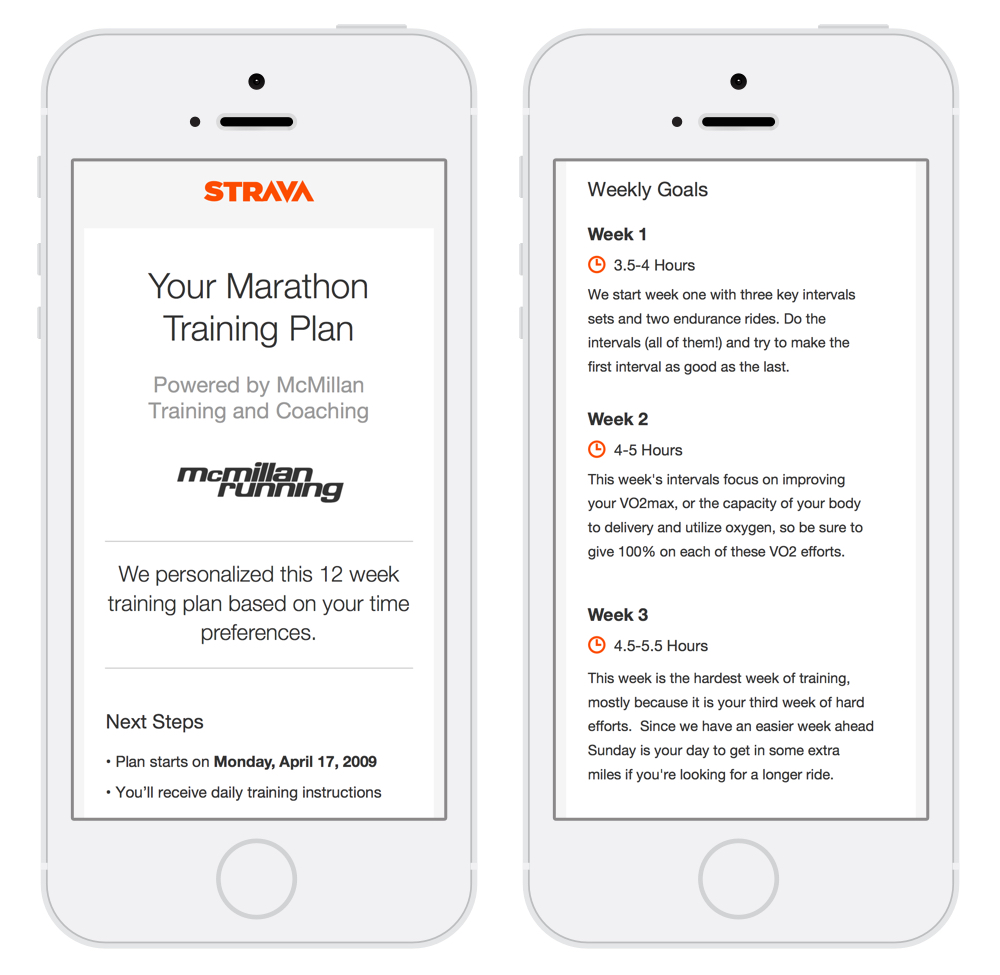
Run training plans are customizable coached plans for different running distances. I worked closely with my UX designer to iron out use cases and edge cases, before creating UI designs for both web. Collaborating with my team, I also created the life cycle web-responsive emails for training plans.
Example of designing for use case, for example if a user enters a date that is sooner than the run of the plan
Training plans work as part of our runner ecosystem that includes Running Races on Strava (which I also led visual design on) and workout analysis.
Exploring visuals to illustrate training load
Workout analysis is a chart view of an athletes running activity with laps. Is an athlete did a run workout with laps, we wanted to give them a way to visualize the intensity of their laps which is integral to run training. I designed the interaction and visual treatment of the chart. A user can mouse over a bar representing their lap effort and see how hard they work, and also see the corresponding lap on a map.
Workout analysis with a lap selected

Log in to Strava for free to view the workout analysis on any activity that has laps (like this one) and a sneak peak of run training plans.
Strava Labs: 10 Years of the Amgen Tour of California
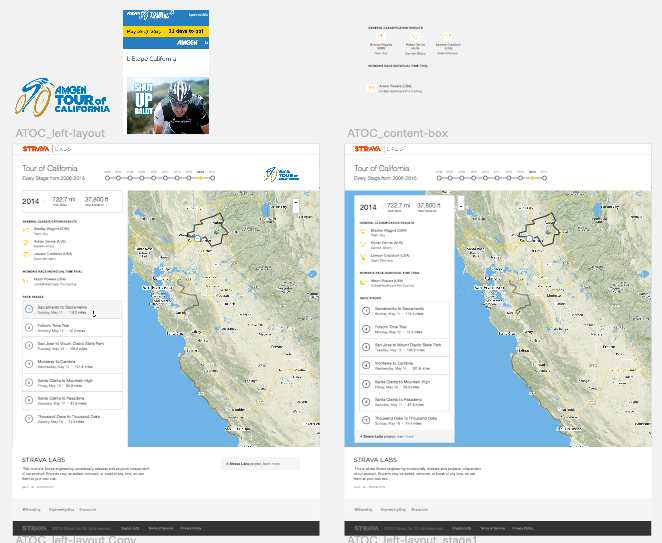
Final mockup of Strava Labs Tour of Calfornia feature
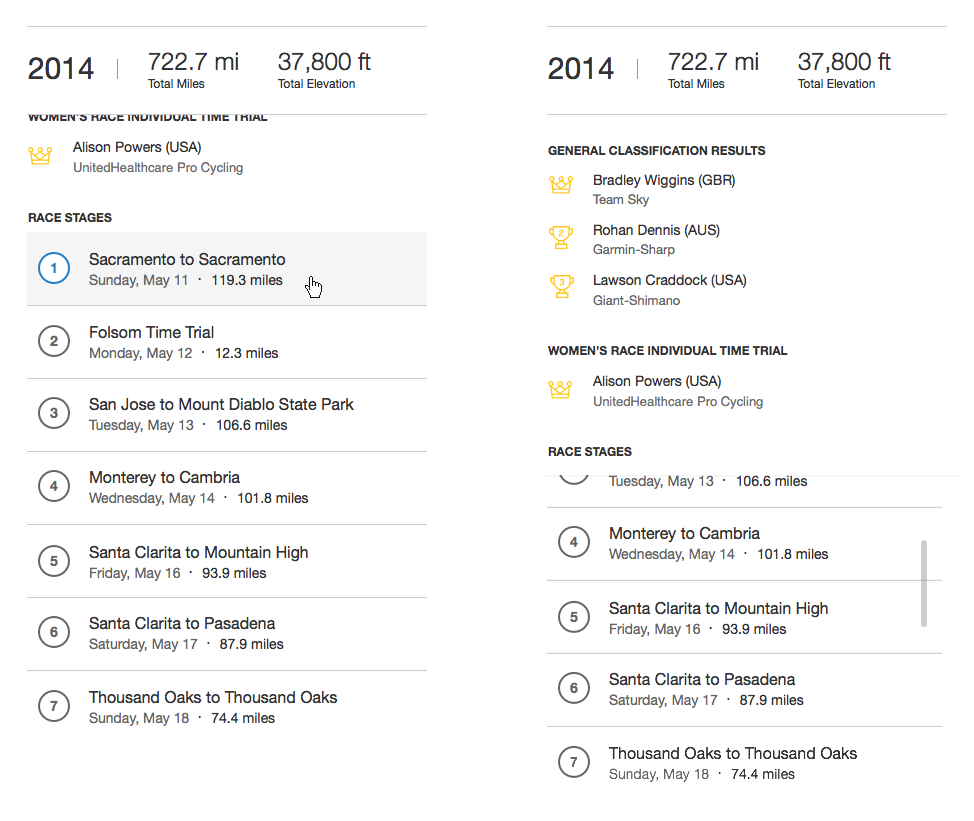
I created the visual and interaction design for this project which utilizes 10 years worth of Amgen Tour of California data. This was fun project utilizing our API to show ATOC routes and pro riders that have their activity on Strava. Users can view stages, see meta data of stages from each year, results, and follow the activity on Strava.
Explorations of layout and scrolling interactions.
Checkout the live version here on Strava Labs.
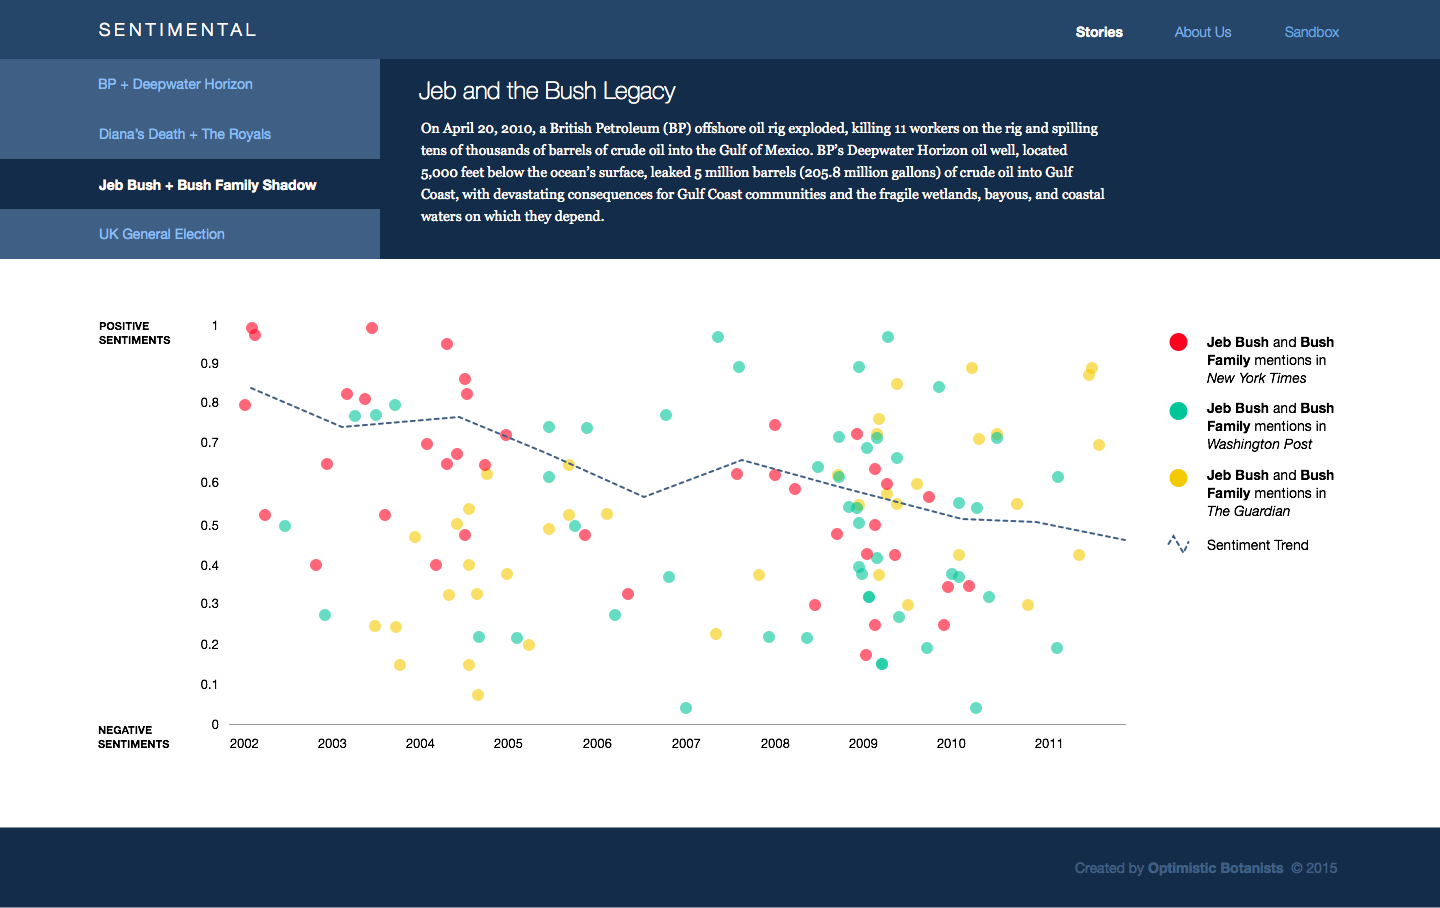
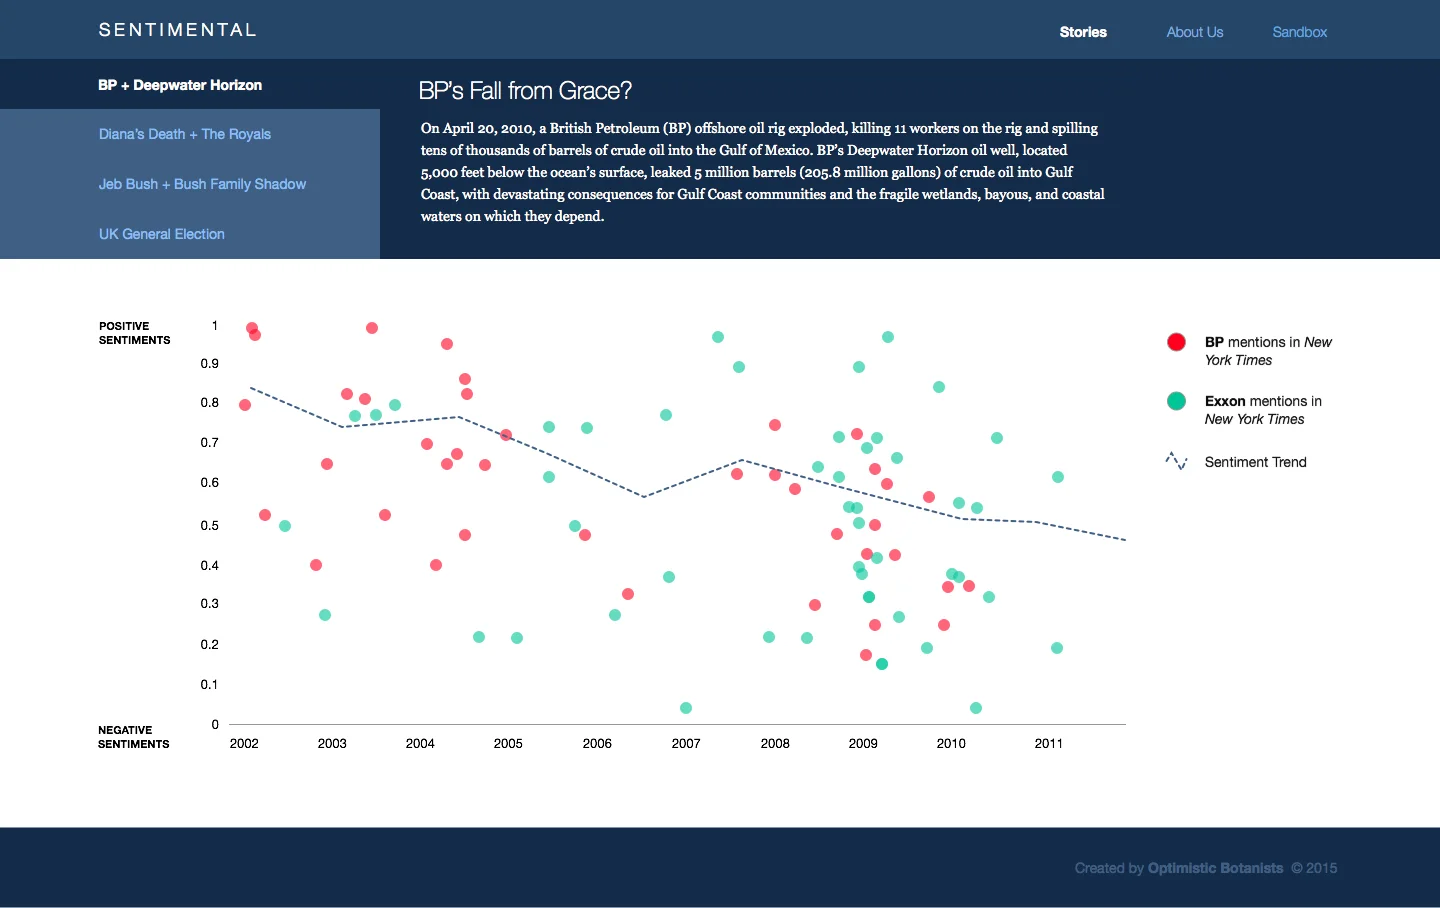
Sentimental - Visualization of News Media Sentiment
Screens from Sentimental Project

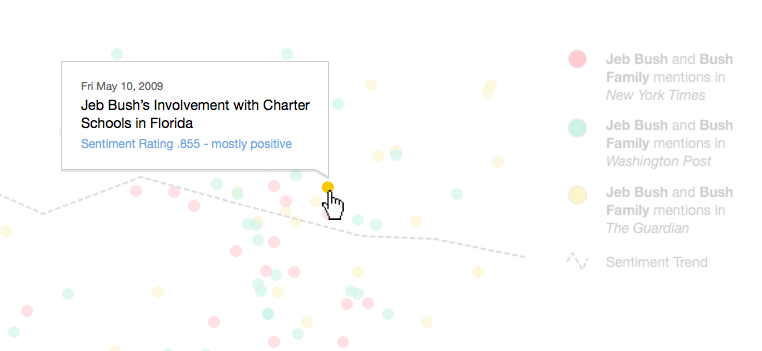
His prototype without design or interaction beyond hovering on points.
Sentimental is a project my partner was working on for fun. He created a data visualization prototype that gave a positive-negative rating to visually show how the news "feel" about certain hot topics over time. He wanted design and interaction, so I worked this out in a couple of hours just a handful of days ago. It was a great design exercise not only work on something with my partner, but just to crank out a small scale style guide.
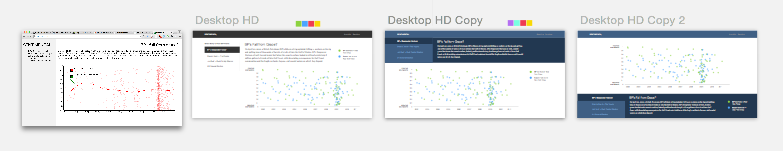
Examples of what I explored within a couple hours for Sentimental
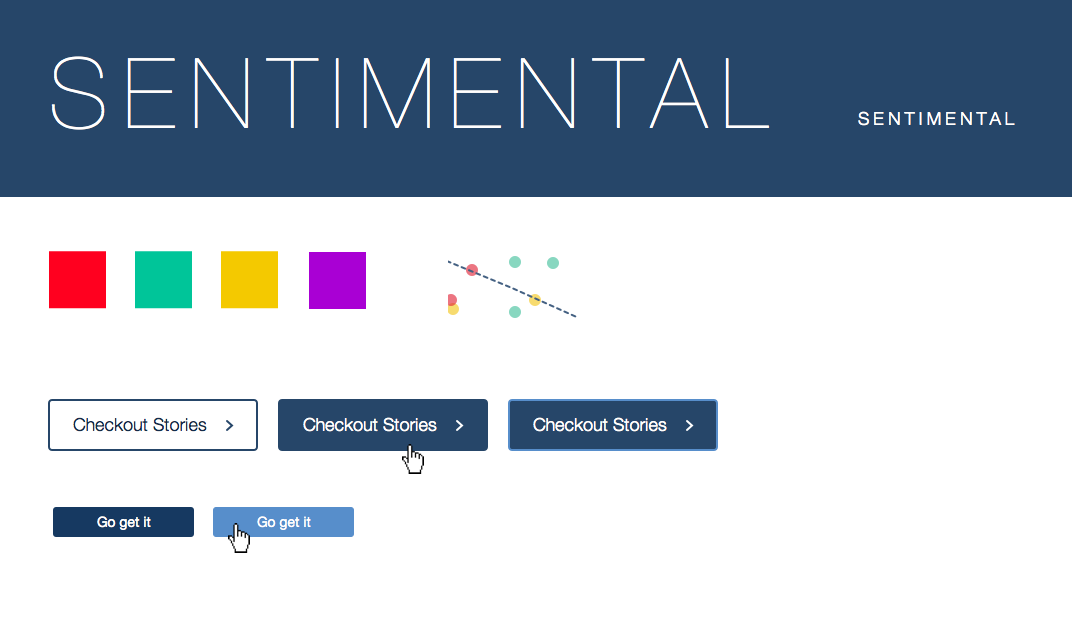
This will be live very very soon (he keeps telling me).